The whole product, on screen.
18 walkthroughs filmed in Antvia, about 2.2 hours end to end. Every screen is the real product working on Acme Home Appliances, a demo company we made up so nothing here depends on a customer letting us film their data. Each episode has chapters and a full transcript, so you can read one in two minutes instead of watching it for eight.
Getting a company's data in, keeping it governed, and knowing when it is wrong.
9 episodes, 67 minutes in total. Read the Antvia Data page for the argument; watch these for the product. Each one has a page here with its chapters and transcript, and plays from the Antvia Data playlist.
 2:27
2:27Antvia Data, in a minute
The introduction to the Antvia Data series. It states the problem the product exists for, what Antvia Data is and what it is not, shows three moments from the product rather than explaining them, and lists what each of the eight episodes covers
 9:43
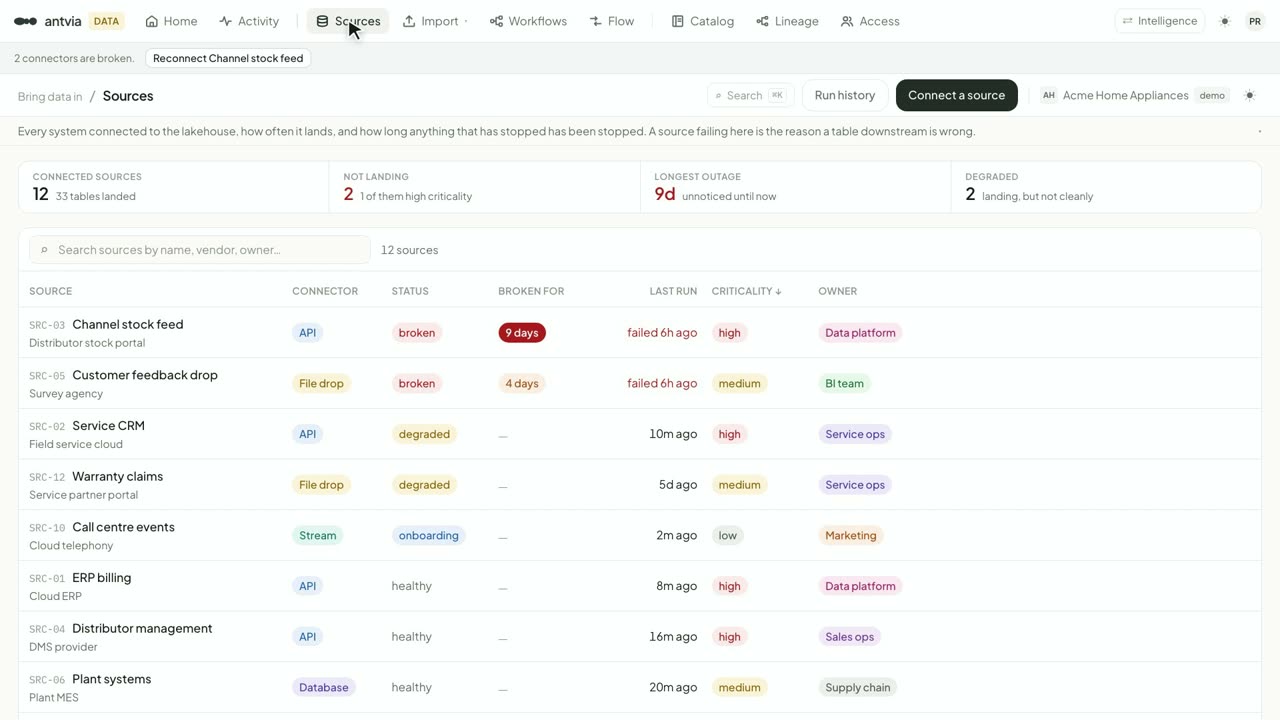
9:43Data in one tour
A tour of Antvia Data for a data or technology leader. It starts on the home page, where every problem on the platform is ranked, then walks the product in the order data moves: sources and files coming in, workflows and runs keeping it moving, the catalog and lineage describing what exists, and access deciding who can read it
 9:32
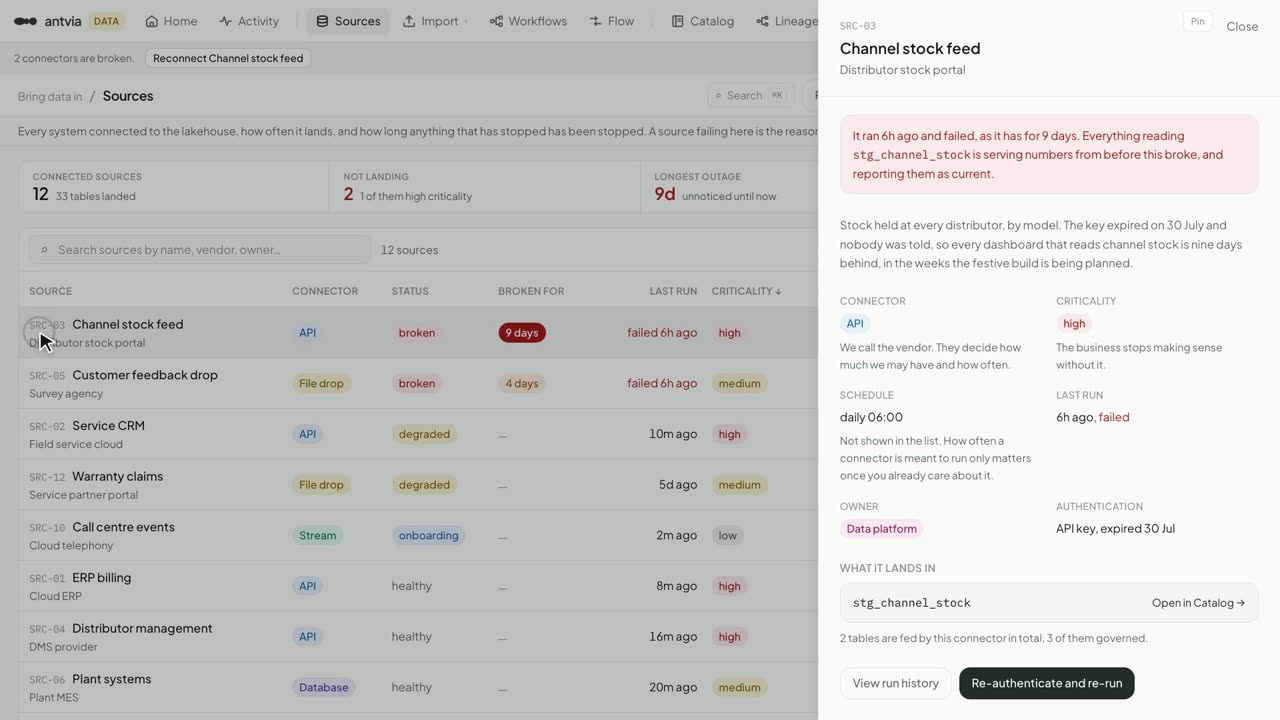
9:32Sources, and the feed that stopped
A close look at Sources and Flow in Antvia Data. It reads the source register column by column, opens one source of every kind, finds sources by search and sort, and follows the failed attempts in the run log
 7:29
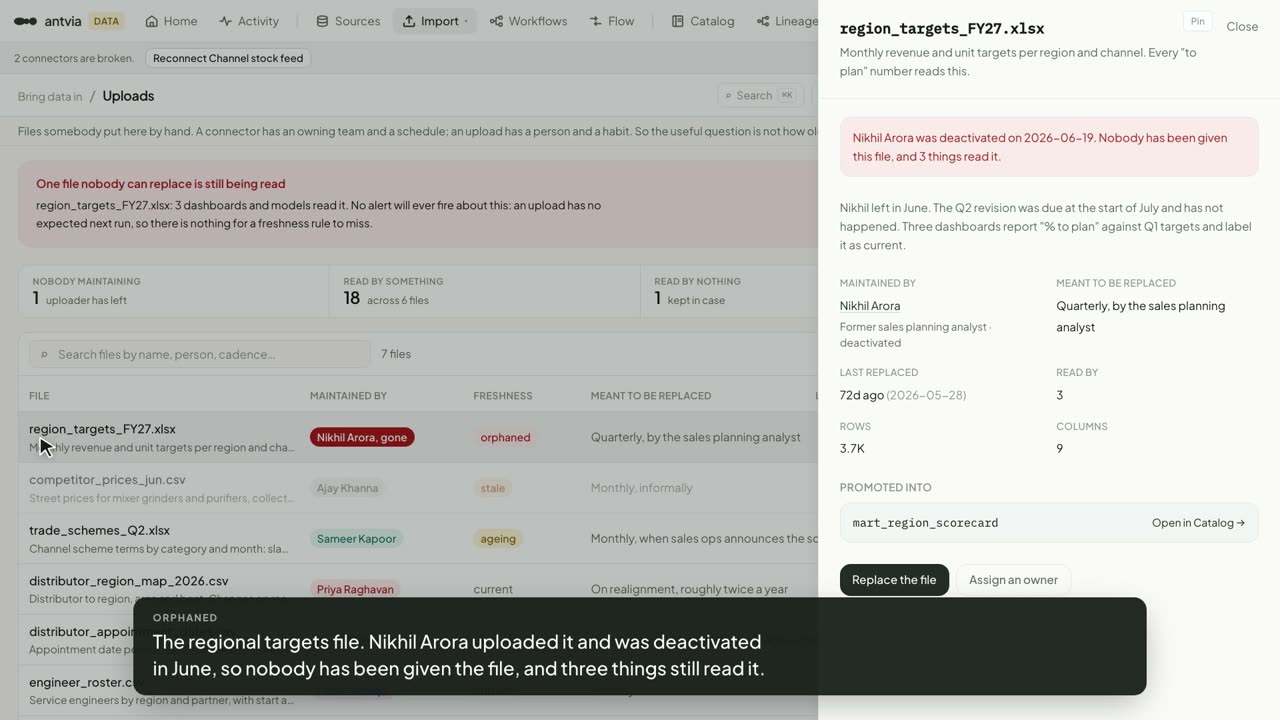
7:29Files people upload, and the columns they carry
Antvia Data treats the spreadsheets people upload by hand as governed data, with an owner and a habit rather than a schedule. This episode reads the upload register, opens a file of every kind, from the orphaned targets file to the one nobody reads, and then moves to the column register: what each column holds, which personal and sensitive columns have nothing protecting them, a policy that exists and is switched off, and three columns that changed under the pipeline without failing it.
 7:40
7:40Workflows: green is not the same as right
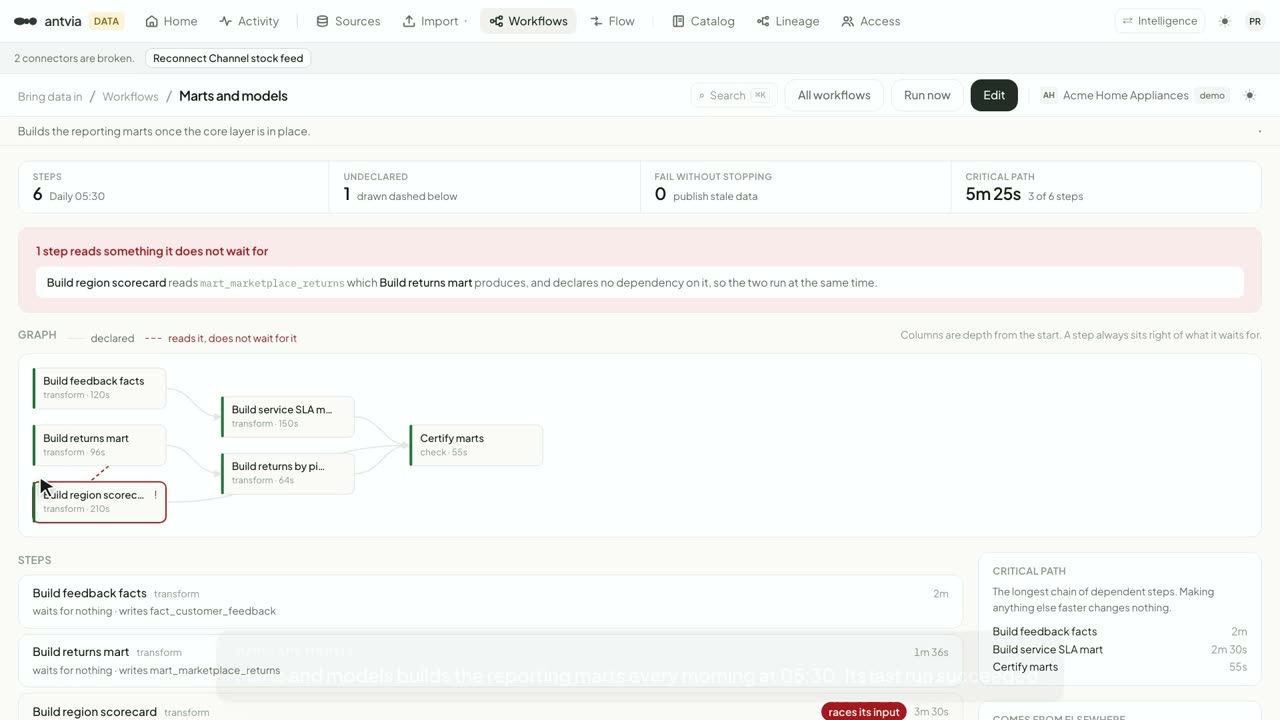
Workflows are the scheduled jobs that turn landed data into the tables people read. This episode shows the two faults that let a workflow run green and still publish the wrong number: a step that reads a table without waiting for the step that makes it, and a step set to carry on after it fails
 7:39
7:39The catalog
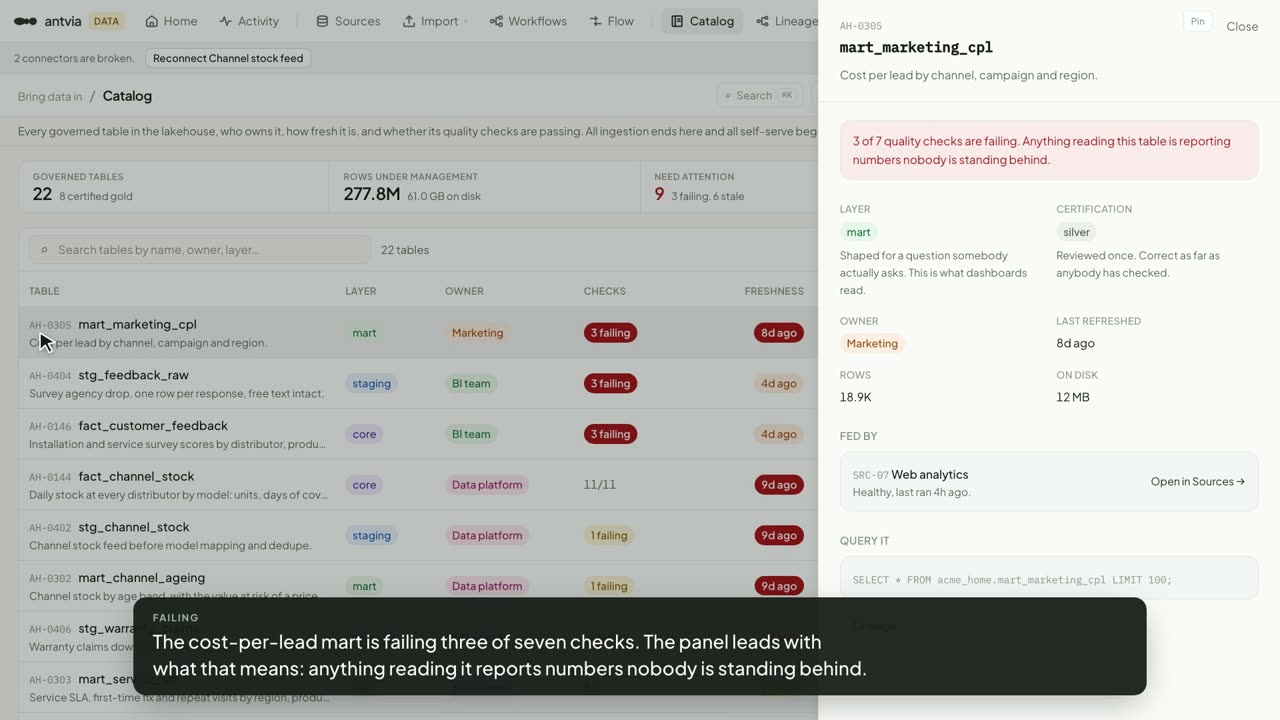
The catalog is the list of governed tables in Antvia Data, with the two facts a reader needs before trusting one: whether its quality checks pass, and when it last refreshed. This episode walks the four layers from raw to mart, opens a table in each state, shows why a gold certificate does not mean current, finds tables by search and sort, follows a failing table back to the connector that caused it, and then shows the same judgement appearing on the dashboards in Antvia Intelligence.
 7:38
7:38Lineage
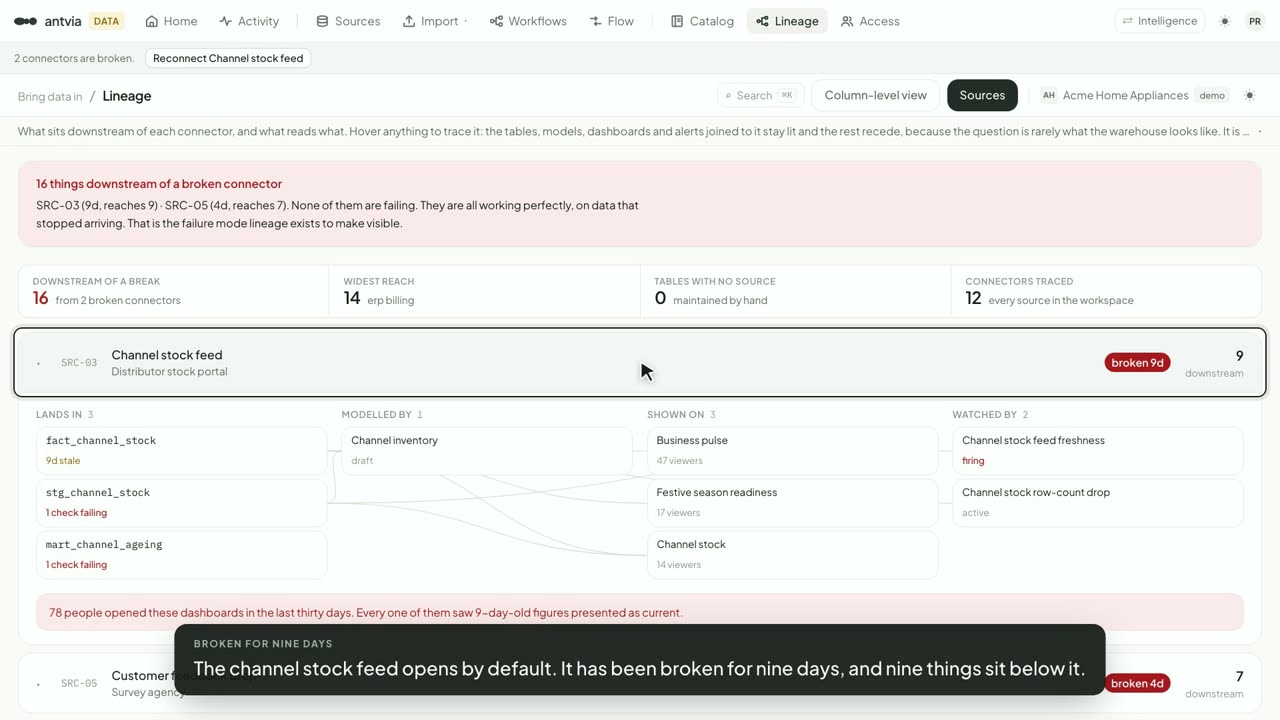
Lineage in Antvia Data answers one question: this connector stopped, so what is wrong now? It is drawn downstream from each source rather than as a map of the whole warehouse, and it is assembled from the other surfaces, not stored, so it cannot disagree with the catalog. This episode reads the chain below the broken channel stock feed stage by stage, traces individual lines, counts the people who saw stale figures, compares a broken chain with a wide healthy one, and repairs the feed from the lineage page itself.
 7:35
7:35Protecting sensitive data
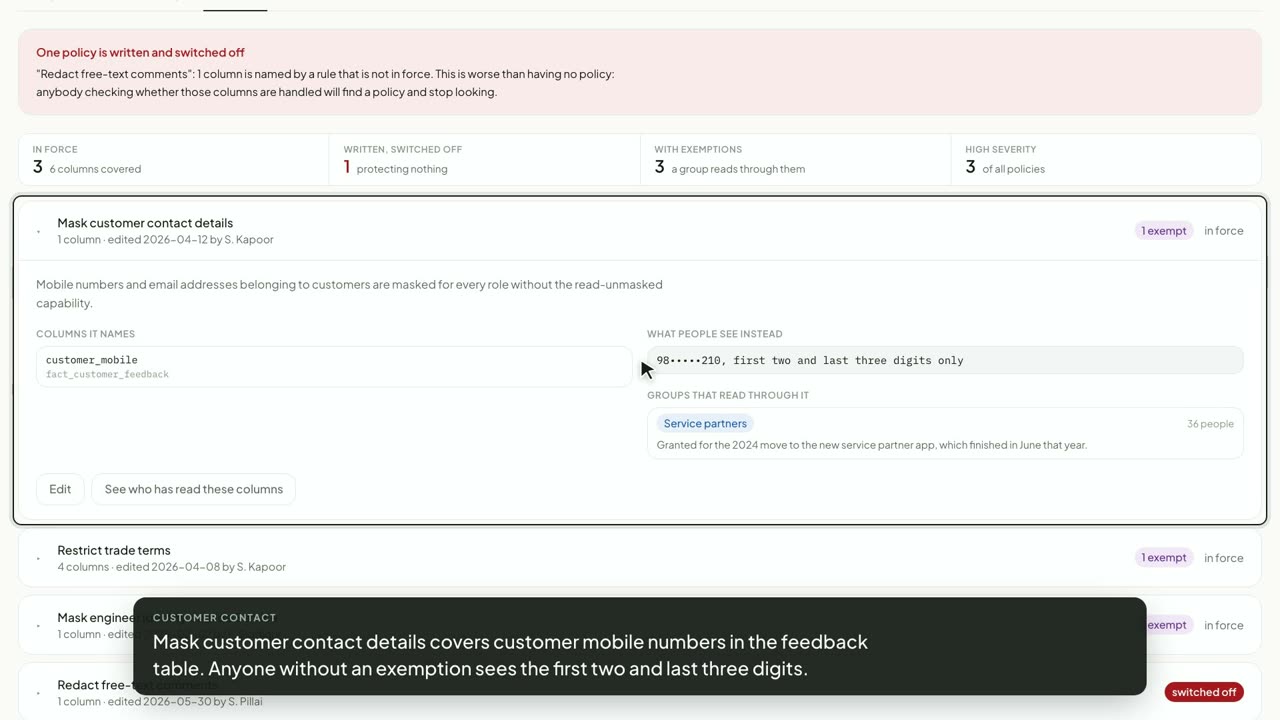
Antvia Data separates three things that decide what a person sees: a role says what they may do, a group says which rows they may see, and a policy says which columns are masked. This episode reads the policy register and what each policy masks, the groups that hold exemptions and the one whose reason expired in 2024, the roles that can read masked columns, and the columns that still have nothing protecting them
 7:24
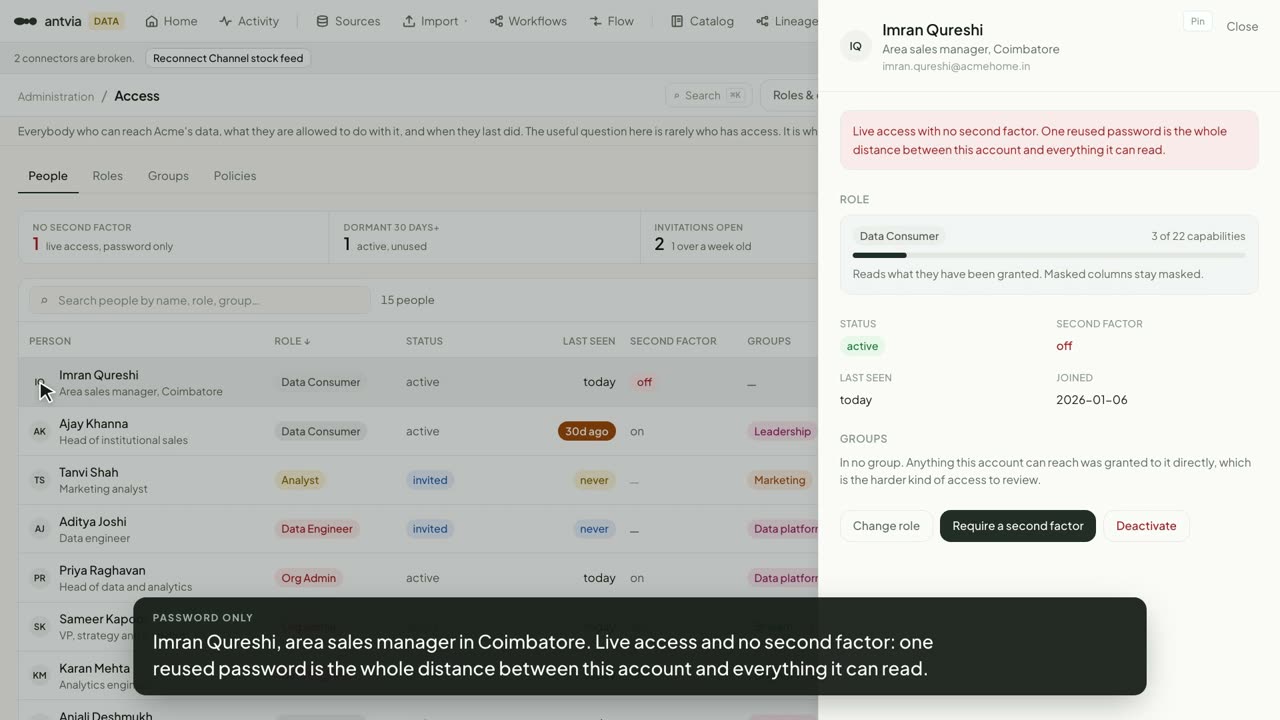
7:24Who can see what
An access register is usually built to answer "does this person have permission?", and the answer is almost always yes. This episode uses the People, Roles and Groups tabs of Antvia Data to answer the questions people actually have: which live accounts have no second factor, which are dormant, which invitations never arrived, and what each role can do
Turning governed data into metrics, answers and decisions you can measure.
9 episodes, 65 minutes in total. Read the Antvia Intelligence page for the argument; watch these for the product. Each one has a page here with its chapters and transcript, and plays from the Antvia Intelligence playlist.
 2:18
2:18Antvia Intelligence, in a minute
The introduction to the Antvia Intelligence series. It states the problem the product exists for, what Antvia Intelligence is, shows three moments from it including a question it refuses to answer, and lists what each of the eight episodes covers
 7:48
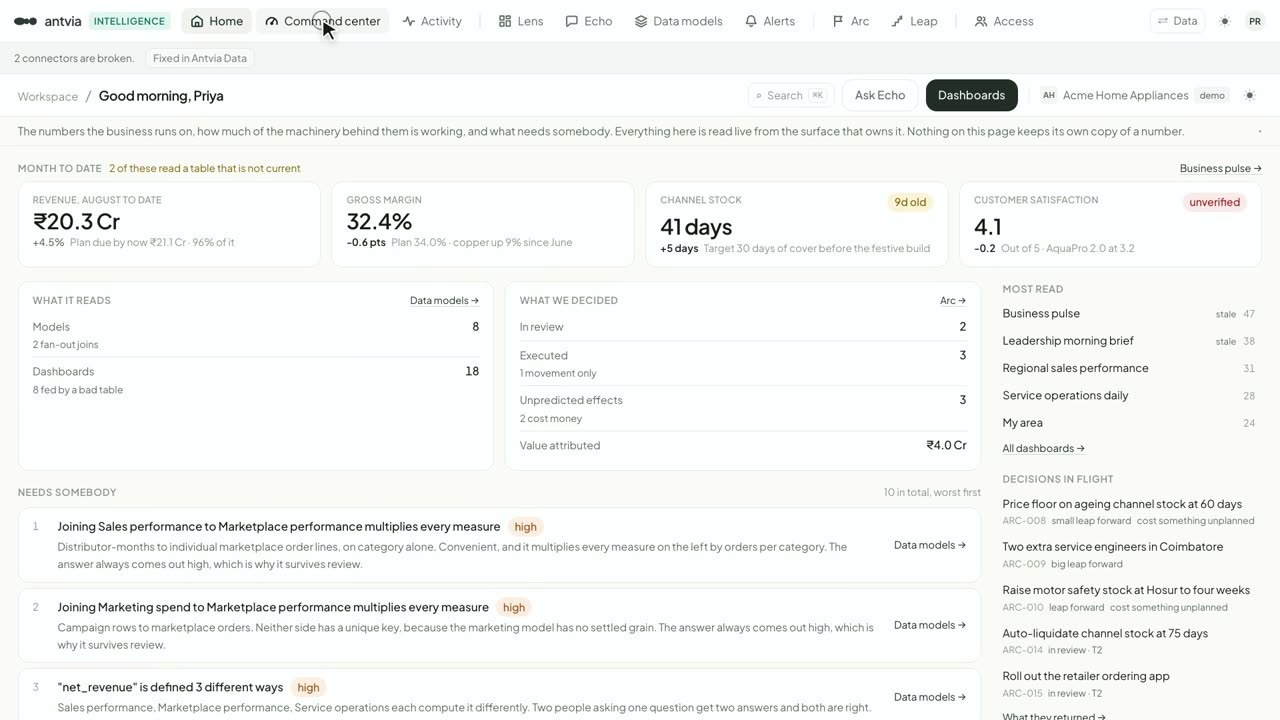
7:48Intelligence in one tour
A tour of Antvia Intelligence for a business or analytics leader. It starts on the home page, visits the command center, opens a dashboard that marks its own untrustworthy tiles, asks Echo questions it answers and one it refuses, shows the semantic models and alert rules underneath, and reads the decision register and its measured results
 9:56
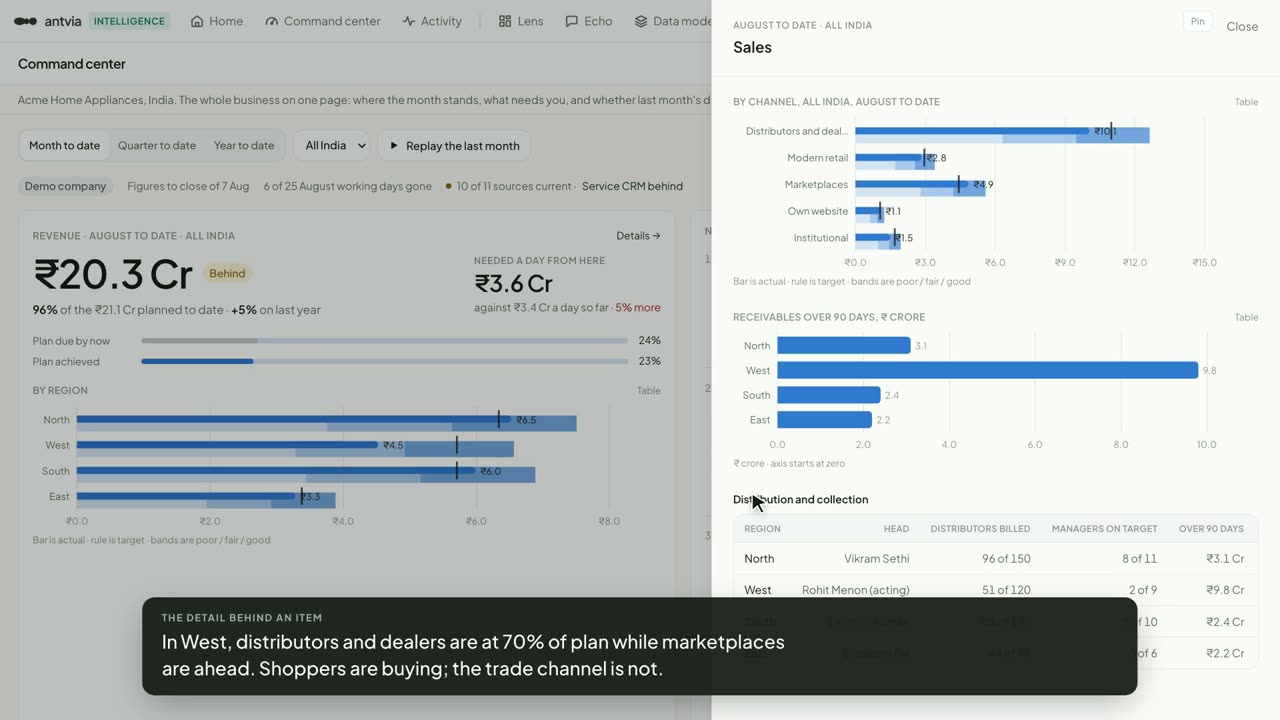
9:56The command center
The command center is one page for the person who owns a business’s P&L across sales, marketing, design, supply chain and service. The video walks through what that person sees first, how each number opens into its detail, how the page got to where it is over the last month, how they act on it without leaving the page, and how the same page works on a phone.
 7:29
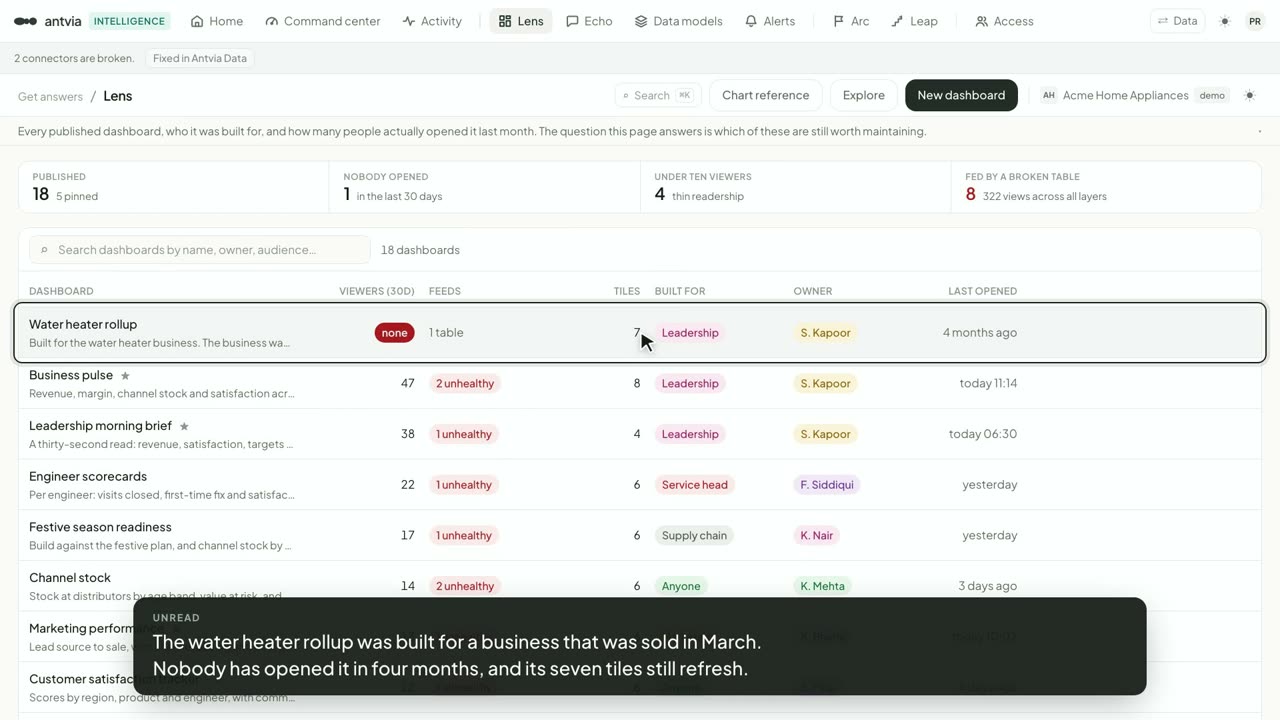
7:29Lens: dashboards, and who reads them
Lens is the dashboard register in Antvia Intelligence. Its central column is readership: how many people opened each dashboard in thirty days, because the failure of every reporting estate is the same pile of dashboards nobody retires
 7:33
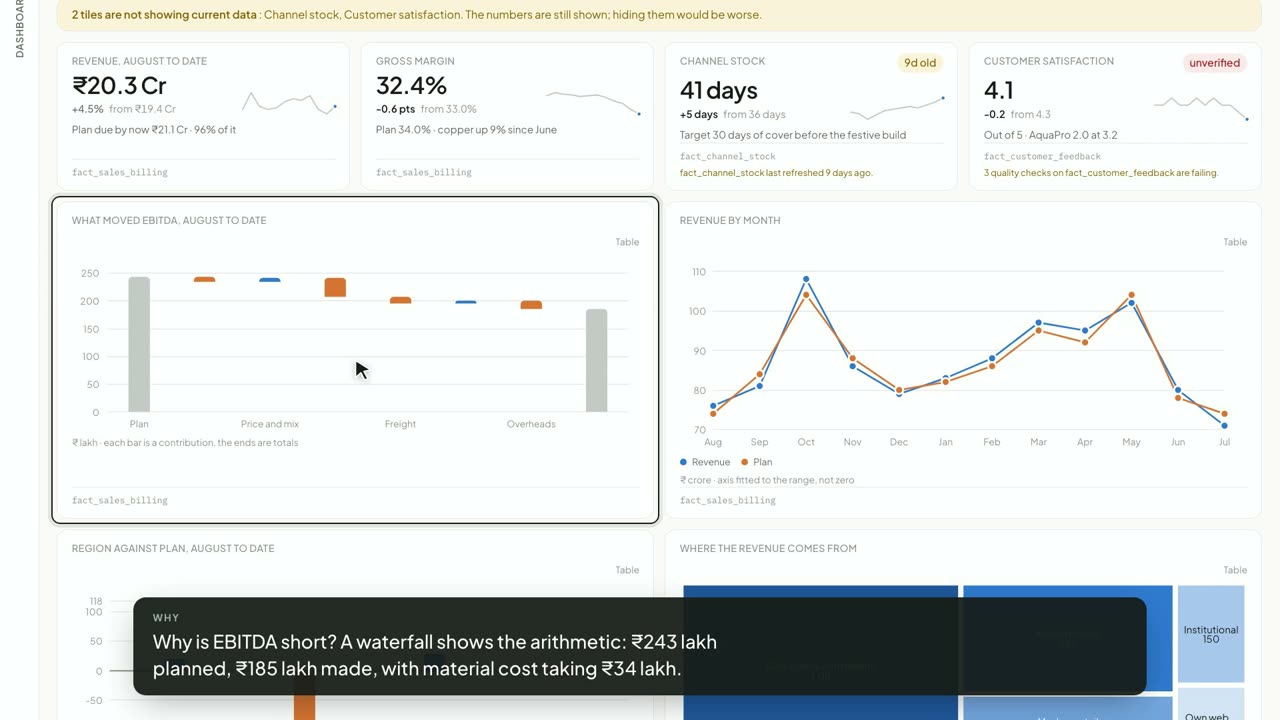
7:33Inside a dashboard
A close reading of dashboards in Antvia Intelligence. It takes Business pulse tile by tile: what a figure tile carries, how a tile says it is not current, and the bridge, trend, gap and split charts beneath
 7:24
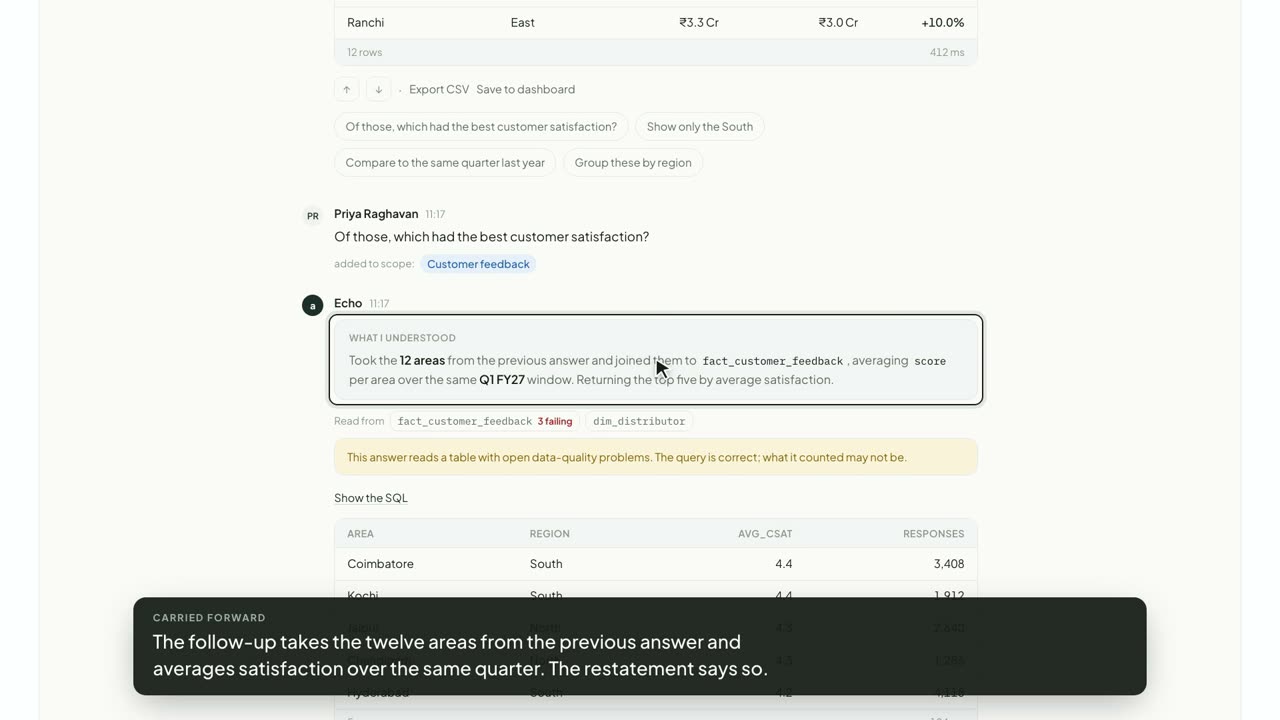
7:24Echo: answers you can check
Echo is the question-and-answer surface in Antvia Intelligence. Its answers are ordered on purpose: what it understood, in tables, columns and time windows; which tables it read and their health; the SQL; and only then the result
 7:26
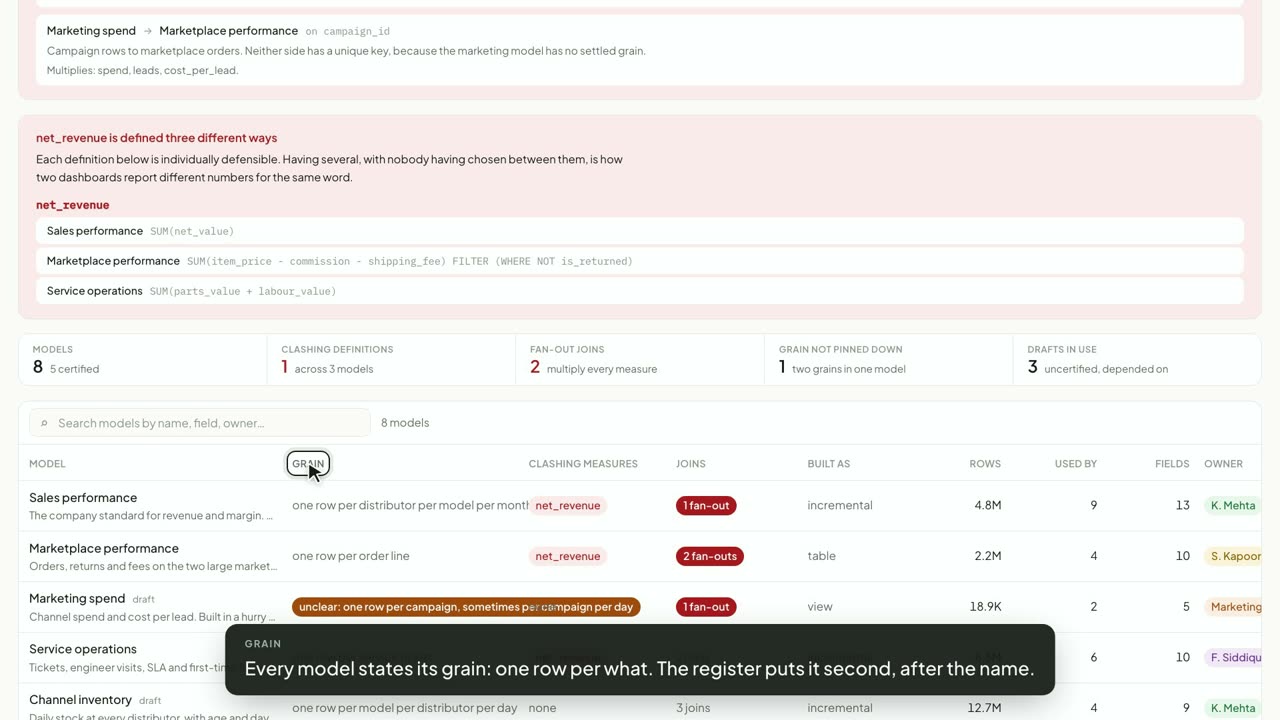
7:26Data models
Data models are the semantic layer in Antvia Intelligence: where a measure gets its definition and where two models are joined. This episode shows the three faults a semantic layer exists to prevent and usually does not: one measure defined three ways, a join that multiplies every number on one side, and a grain that hedges
 7:25
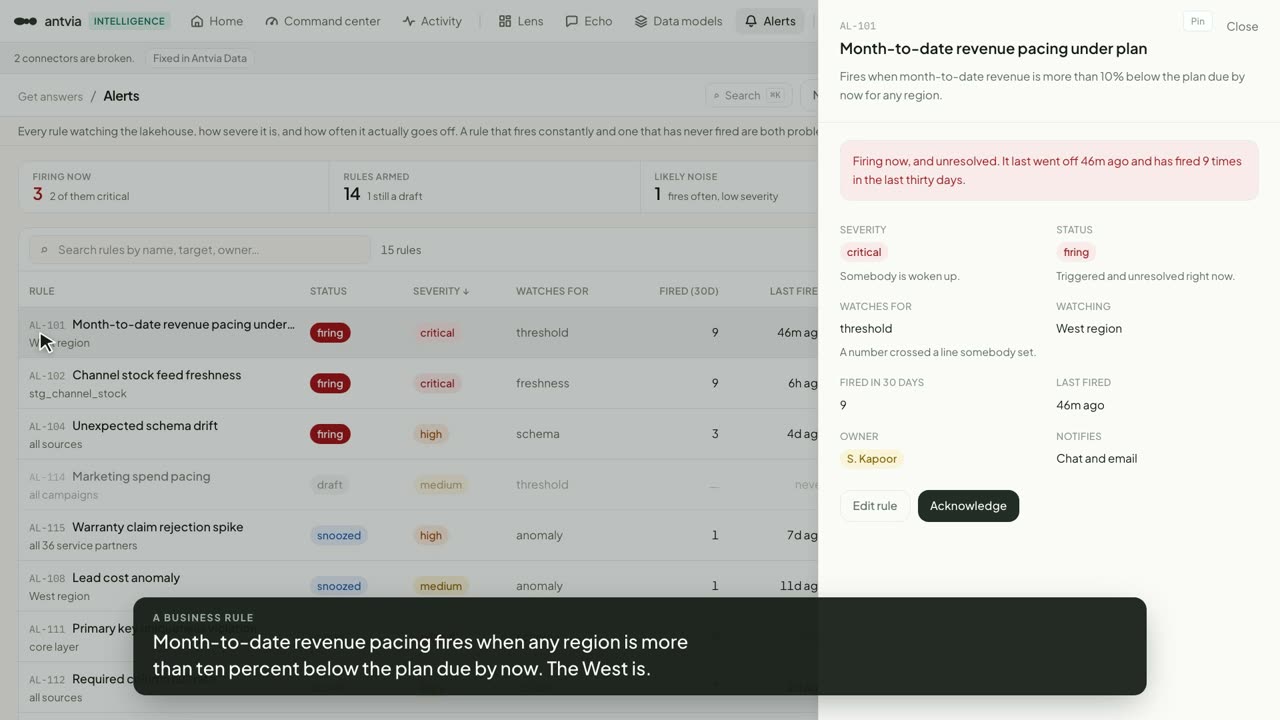
7:25Alerts
Alerts in Antvia Intelligence are rules watching the numbers and the data behind them. Every rule carries severity, how bad it would be, and status, whether it is firing now, as two separate facts, because blending them either shouts about a rule that has never triggered or hides one that is triggering now
 7:36
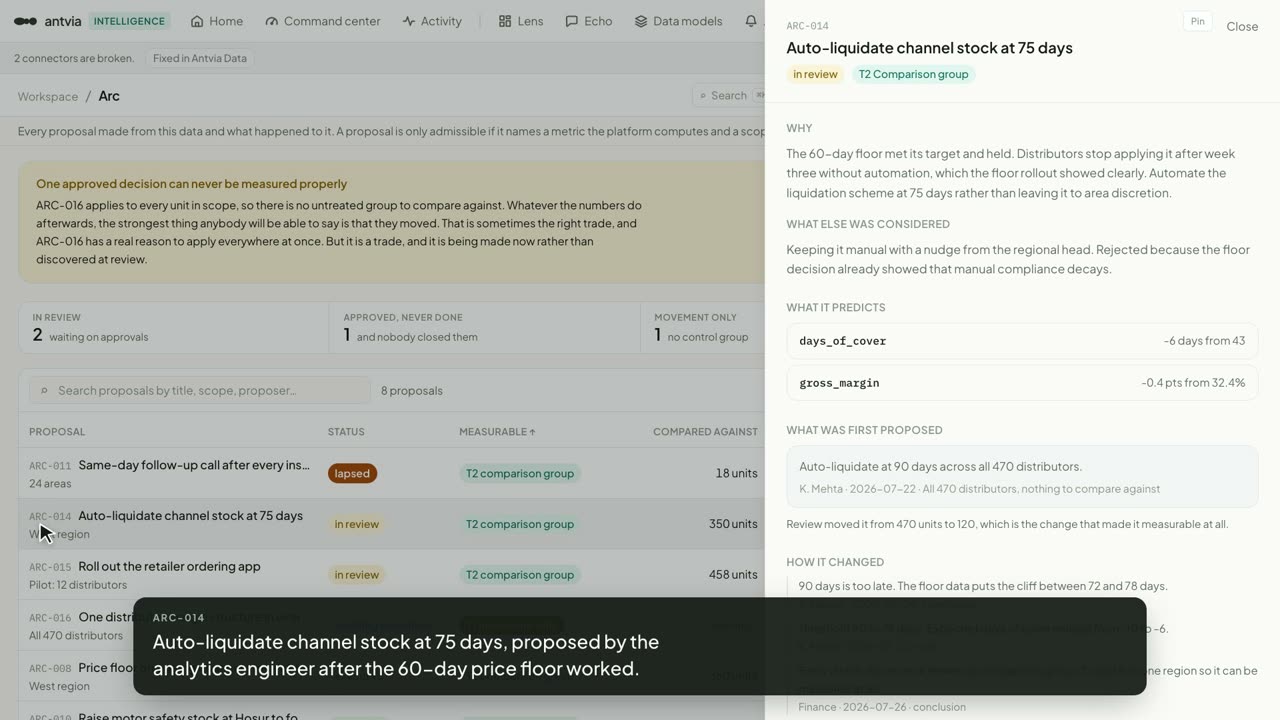
7:36Arc and Leap: decisions, and what they did
Arc is the decision register in Antvia Intelligence, and Leap reads what each decision did afterwards. Arc admits a proposal only if it names a metric the semantic layer computes and a scope it applies to, and it shows, while the proposal is still a proposal, whether the scope leaves anything to compare against
See it on your own data.
Thirty minutes on the half you came for. Bring the report that breaks every month, or the decision you never settled.