All your business data in one place. Without hiring a data team.
Every system you run, landed and governed in weeks, with the metrics and the answers on top of it. In your own cloud, on open formats.
- Connectors where they exist, uploads where they do not
- Every metric defined once, so two reports cannot disagree
- Ask in plain English and see the tables behind the answer
Three things, and you own all of them.

Everything lands
The ERP, the CRM, the plant systems, the marketplaces, and the spreadsheet nobody maintains.

It stays honest
Lineage on every hop, checks that stop bad data before anyone reads it, and masks enforced at query time.
Anyone can ask
In plain English or in a dashboard, with the tables behind each answer named and their freshness shown.
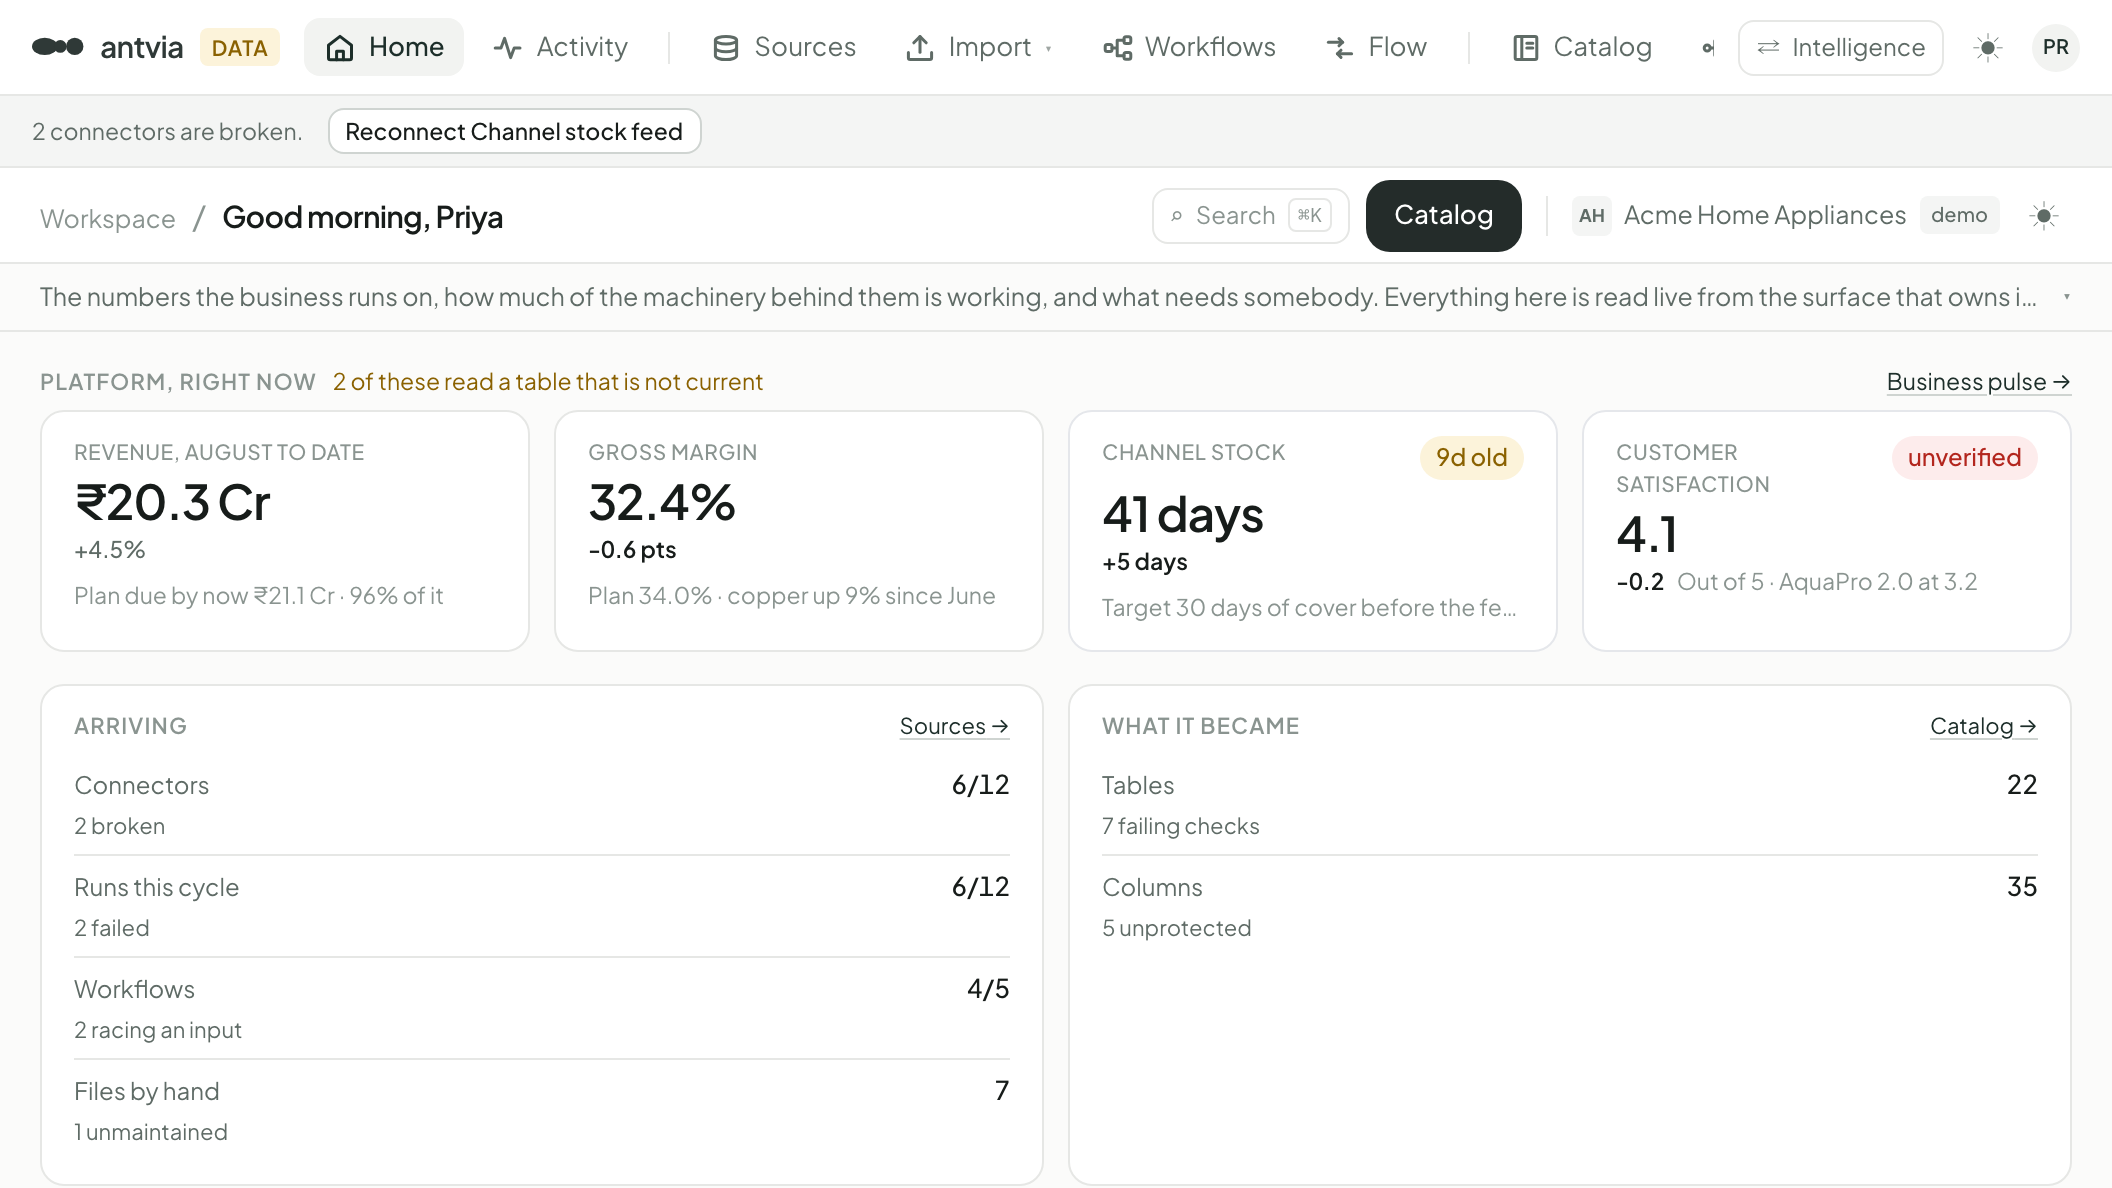
Eight screens, in twenty seconds.
The real product, on Acme Home Appliances, a demo company we made up so nothing here depends on a customer letting us film their data. Hover to stop on one.
Companies with a lot of data and nobody to run it.
 Acme Home AppliancesConsumer appliances
 Fernhill Specialty ChemicalsSpecialty chemicals
 Quillon DiagnosticsDiagnostics and pathology
 Larkspur SoftwareB2B software, data-heavy product
 Tollgate FinservLending
These five companies are invented. They are the shapes of business Antvia is built for, written out so the product has something concrete to work on, and Acme Home Appliances is the company you will see inside the demo and the videos. None of them are customers.
Benchmarked against the platforms you are comparing us to.
On one real workload, not a synthetic test. Every figure is reproducible and the method comes with the report.
Everyone sells dashboards. Nobody tells you what the decision was worth.

A proposal has to name a metric Antvia computes and a scope it applies to, or it is not admitted. Afterwards it reads that same metric back, against what was predicted and against the parts of the business nobody touched.
That is how you find out what a decision was worth, including the effects nobody wrote down.
Bring your messiest source.
The demo works better with a real problem than a clean one. Show us the thing that breaks every month and we will show you where it would land.